The Team at Social Beat is excited to announce that Social Beat has now gone from being an accredited Google partner to becoming a Premier Google Partner for Google Adwords/Pay Per click Advertising.
Our newly acquired Premier Google Partner badge certifies us as a company trusted by Google, which is capable of providing the highest levels of service to clients.
We have fulfilled Google’s three main requirements for being a Premier Google Partner.
Google requires the team handling Adwords to prove their advanced AdWords knowledge by getting certified in AdWords. All team members handling Adwords campaigns at Social Beat are certified by Google to have the required levels of competency and proficiency to run successful campaigns.
Premier Google Partners are required to demonstrate that they are maximizing their clients’ performance by implementing Google’s recommended best practices in client accounts.
Google reviews Partner agencies’ client accounts to make sure that their clients are getting excellent service, including the type and frequency of the changes being made, client retention, and whether they’re making the most of their clients’ budgets.
The new badge is designed to recognize Partners who manage a substantial portfolio of Google advertising campaigns and deliver great results for their customers
Contact Us to get your Adwords campaign started or to optimize an existing campaign for better ROI.
Facebook Marketing has become an integral part of any digital marketing strategy and it has revolutionized the way we look at the online marketing industry. Over the last 12 years, Facebook has seen a 360-degree shift, transforming from a simple social networking site to the face of a multi-billion dollar company allowing brands to find new customers, increase their sales, create brand awareness and much more. When we ran an industry survey amongst CMOs and Brand Heads across India we found that close to 90% Brands in India are already leveraging Facebook. Advertisers are spending more money than ever before on Facebook as it has emerged as one of the biggest platforms to engage with their target audience. Keeping this in mind, new features are being regularly added to Facebook and marketers have to constantly make alterations to their strategies to ensure their content is still reaching its target audience. Below are a few points that have been gathered keeping in mind the recent changes which may give us clues as to what 2017 will hold for both consumers and businesses. You may also find it interesting to read our book on Digital Marketing Insights for 2017, which can be purchased on Amazon.
Following the decrease in the organic reach of Facebook page posts last year, Locowise conducted a small study to analyze how page posting frequency impacts reach, engagement and negative feedback.
The study reveals that pages that posted once a week or less on their official page reached an average of 15% of the audience who liked their page per post. Interestingly, pages that posted two to four times a week reached only 10% of the page audience and pages that posted once a day reached a lower average of 8.42% per post. This means that organic reach drops with an increase in the number of posts, and over posting content is a common mistake marketers tend to make on FB. This also means that the quality of content and FB posts needs to be extremely high and we are likely to see many brands evolving into fewer but highly engaging posts.
Another study by social@ogilvy reveals that for large pages with more than 5,00,000 Likes, the organic reach has seen a remarkable decline when compared to other smaller pages. It is believed that marketing managers can expect the organic reach to further approach zero in the future. The detailed analysis and data interpretations along with the recommendations are available to read here in the full white paper.
The number of users on Facebook has doubled from 845 million to 1654 million over the last five years. There are more brands than ever who are joining the bandwagon of Facebook marketing and these brands are posting multiple posts every day. All of this creates more noise and unimaginable amounts of content that will simply be filtered out and never reach the news feed of a specific user. With so much information to be filtered, Facebook uses complex algorithms to pick and show content to users they are most relevant to them and those that they are most likely to engage with.So it can be assumed that increased brand post frequency is aiding in the drop of organic reach.
However, the only exception to this organic reach debate was seen in the news & media industry. The organic reach of news publishers seems to remain steady, even with a higher posting frequency. Here’s the result of analysis of 3,318 profiles, by Sotrender.
Videos are the next step in the social media evolution and will most likely dominate the online advertising and marketing industry. As per the stats by Facebook, users watch an average of 100 million hours of video every day and most of these are on their mobile devices. Daily views have increased from 1 billion to 8 billion in the last one year. These stats are proof that users have started consuming more of video content and it is essential that brands leverage this in their favor to engage with the potential customers. Video content is the best medium for storytelling and is a great opportunity for brands to connect with their audience.
Live videos were one of the major updates announced earlier this year by Facebook. This gave live videos prime placement in the Facebook app and also adds new ways to find, create, share, and react to them. This move efficiently makes live videos one of the central features of Facebook. Live videos offer a new way to interact on a platform that can feel so familiar that it risks feeling stale. Broadcasting live to your social circle gives you a certain thrill or even just watching a friend’s live broadcast, can bring in a fresh feeling of excitement and make you want to interact on the same old platform in a new way. On an average, Facebook says people are commenting 10 times more on live videos than they do on regular videos. This clearly means that brands must explore Live videos over recorded videos as this would help drive higher engagement levels with the audience. Facebook also rolled out an update where advertisers could add a video element for FB Carousel Ads. The shift towards video as a tool for marketing is evident and is definitely here to stay.
We also have an interesting blog on how to create low cost videos to tell your brand story – in case you are creating videos for the first time.
The fact that a business needs to have a mobile-friendly website is much talked about and is not a new concept. Last year, Google announced that, for the first time mobile searches surpassed desktop searches. This eventually led to a new situation where Google’s algorithm started to penalize sites that were not optimized for mobile devices. For the last few years, marketing experts have been stressing on the fact that there is an obvious need for businesses to optimize the sites for the ever-increasing number of mobile users. Facebook Inc announced that it has over 142 million users in India, of which about 133 million access the social network via their mobile devices. This means that a staggering 90% of users are using facebook on their phones in India. It is essential that marketers who are trying to engage with and attract potential customers in order to redirect them to their website, ensure that their website is mobile optimized and are able to leverage every micro moment of Indian consumers. In today’s Smartphone era, mobile-optimization is the norm and an essential item that can no longer be placed on the back burner to address later.
A few years ago, advertising on social media platforms was a very niche concept with not too many players in the market. In this new age of online marketing, many brands have become aware of the importance of ads across various social media channels, especially Facebook. Today, with the various targeting and advertising options on Facebook, we can reach out to millions of potential customers in any part of the world. Facebook advertising is a strong tool that can be used by brands to meet their marketing objectives.
Facebook ads allow you to choose from a wide range of possible adverts including but not restricted to Page Post Engagement, Clicks to a website, Conversions on Website, App Installs, Video Views, Lead Ads etc. Over the last few years, Facebook has evolved into a paid marketing platform more than an organic one so it is essential for marketers to leverage the power of the various adverts available. You can read our detailed guide on measuring ROI from social media.
In an attempt to make it easier for brands to reach out to potential customers and drive sales on mobile devices Facebook has started rolling out the Shop section in phases. This section allows a brand to list out their products and let consumers browse through the catalog and purchase products that they like from within Facebook. The social network does not charge you to add a shop section to your Page nor does it take any percentage of the money you make through it. In the upcoming year, more businesses will start selling stuff directly from Facebook as this new section is set to change the way we look at e-commerce and social selling. Ofcourse it also has had Product Ads for E-commerce companies for a long time now – these can be also be leveraged parallely.
We have left out Instagram Marketing from this conversation, as it warrants its own blog. We are also seeing some interesting developments around Instagram analytics and Instagram targeting going forward.
Do let us know what other features you expect FB to evolve in the coming months.
According to HT Digital and IMRB Report (India) on “Student online behavior,” 93% of students access the Internet every day and 73% of students use the mobile phone. Nearly 91% access the internet to collect information about colleges and courses. Thus, going online for universities and colleges has become inevitable. Although this calls for investments in creating digital assets, building strategies and online advertising, the costs are quickly realized, easy to the track and attributable. The ROI is much higher in comparison to any traditional mediums used.
The following are 7 ways that universities and colleges can use digital medium in India.
A good website is a blend of three elements, namely aesthetics, functionality, and ease of use. A website is a very strong representation of any brand on the internet. The three elements are elaborated below
A well-designed website for a University or college needs to address the following factors-
The functionality of the website is what determines the final design aspects, these have to be defined ahead, and some of them are listed below
Unless a website is not created with the end user in mind, it will fail to give the results that it had intended to achieve. It has to be “easy to use” and intuitive. The following are key aspects to keep in mind. These aspects may not be always set right a 100%, but a study of user behavior over a period of time can help better these aspects
Developing a mobile version of the website is also a great way to boost the recruitment of students, as today many young people have access to a smartphone or mobile device. Also, SEO (Search Engine Optimization) is a key to drive organic traffic to the website, without traffic there is no point of having a website. The SEO will drive students/parents looking for relevant courses and information to the website.
Colleges and Universities must use social media to engage with current/ prospective students and parents. They should use social media to connect in a proactive manner, by engaging and demonstrating that the institution cares for its stakeholders. Content built with the right balance of words and visuals is well received and attractive to target audience. Several channels such as Facebook, Linkedin, YouTube, Twitter and new age channels such as Instagram can be tapped to achieve various goals. A mix of content and imagery
Social listening enables universities and colleges to proactively listen to the students and their concerns across platforms. These tools can be used to build solutions to serve the students/ parents. Many universities in the west use twitter tools to engage with students and the community. Also, intercepting prospective/ current student conversations and directing them to the right information in real time/ quickly helps build a lasting impression about the educational institution
Digital advertising can be used to drive admissions, reach out for campus placements and to improve visibility the in the short term on search engines. Digital Ads can be placed across the Google network and on social media, i.e. Facebook, LinkedIn, Twitter, and can be targeted and optimized to reach the right audience. In the current generation, the students rarely use the traditional press for information gathering and hence making any spends primarily on digital ads makes more sense. The ROI is both traceable and visible, making every penny spent, accounted.
Well-designed mailers serve two primary purposes for a college/university. A mailer is a personal touch-point with the receivers and hence,
Students are constantly looking for information to further their study and careers, much in advance of them even graduating from schools. They use the internet to help them prepare better for tests, chose educational institutions or look for career guidance. A University / college can plug into this requirement and serve as a thought leader in the educational space, thereby adding value to their branding. Blogs are a good way to attract prospective students and also improve search rankings on Google.
It is a humongous task to have prospective applicants and current students pay fees and make other payments over bank counters. A college/university website can integrate this functionality into their website and increase application conversions as well as ensure compliance of fee and other payments on time by students. The website and Social Media can also be used to communicate deadlines periodically for the same purpose.
Need more insights on how to educate the younger generation on building a career and making it big in life? Subscribe to our YouTube channel Arrear Irundalum Career for handy tips and tricks on making the right choice. You can also check out our Arrear Irundalum Career website for more information on career guidance tips in Tamil.
Going digital for University/College is not a decision anymore; it is just a “Must”. It is not what needs to be done, but “how to do it” that will make one university/college differentiate from the rest. It is important therefore to set the key USPs and define measurable goals before building a strategy and making expenses on the digital assets and advertisements.
Analytics is by far one of the most important tools to help a company sell on the social media platform. Yes, driving traffic to the website is equally important, but how do you find out what happens after that? That is where web and social media analytics comes to play. Every social networking site has its own set of analytics that are both accurate and user-friendly. While Facebook, Twitter, Pinterest has inbuilt analytics, Instagram was lacking in it. Though Instagram shares the same ad platform as Facebook, the platform does not yet have an analytics tool like Facebook’s Insights and Audience Insights. Fortunately, there are a number of third-party Instagram analytics tools available for businesses and marketers to measure their marketing efforts until recently when Instagram announced its insights feature – Instagram ‘Business Tool’that will be made available directly in the app for its users!
While this happened, Instagram again made heads turn for yet another new launch – ‘Business Profiles’. This tool is truly an advantage for small businesses, which can enjoy the ease of mobile marketing on Instagram which will also help reduce the gap between the consumers and the brands. While Instagram’s carousal ad sets and videos have already been helpful for easy marketing, introducing mobile ad-buying and Analytics, which will help view the most viewed and liked posts, post engagement rate, website clicks, impressions, reach and a lot more is definitely a big step for Instagram that has been appreciated by 500 million users who see 95 million posts amongst which a minimum of 48 million posts are ads by marketers every day. If you are still deciding whether to use Instagram for your brand – here is a guide on how startups can use Instagram.
Key Features of Instagram Analytics
Instagram Analytics dominantly focuses on Follower Demographics and Post Analytics. Below, you can view your top posts segregated by Instagram based on its impressions for a 7 day or a 30 day period. This will help you understand how many people viewed your posts other than just liking it, giving you an accurate engagement rate, thereby helping you understand if there is a need to improve your marketing.
Amongst all the information that is available, Follower Demographics is a very useful tool, especially for the small time marketers. It helps them discover where their audiences are coming from. Apart from exact locations, it also helps determine the right time to market to them from different time zones.
Again, similar to any other analytics tool, Instagram also lets you break your audience by gender and age to quickly analyze if men or women have contributed to the most number of views, likes and engagement rate.
The ‘Followers’ module is yet another major advantage for marketers to keep a track of the time and the number of hours their consumers are on Instagram on a selected day. This will again help them understand the right day and time to advertise which will surely be beneficial to grow the brand.
Apart from hardcore analytics tools, Instagram has also been experimenting with a few other profile features that seem to be quite useful for businesses to lead traffic to their websites and increase their sales. One of these features is the new ‘Contact’ button besides the usual ‘Following’ button.
The ‘Contact’ button is a linkable location tag which when clicked will show two things – ‘Email’ the user or ‘Get Directions’ on your maps to their store.Since finding the location of Instagram brands has been a major pain point for both marketers and users alike, this new feature will be of some aid.
The second feature is a direct plus-point for brands/products that have been looked around or searched a lot in social media. While hashtags are used on Facebook and Twitter to quickly spot these products, Instagram has introduced an extra line underneath the name in the profile.
While these features are not yet open to all users, they have been introduced for marketers in the US, Australia and New Zealand and in the following months, will be accessible on a global level, including India. Boasting over 300,000 marketers leveraging on Instagram, it has become an ideal platform for small businesses to resort to a much easier and visually appealing mode of marketing that will be directly benefited by this new Analytics tool amongst the others and other special features for brand building.
We will have a more detailed analysis once we are able to use the tool for more brands.
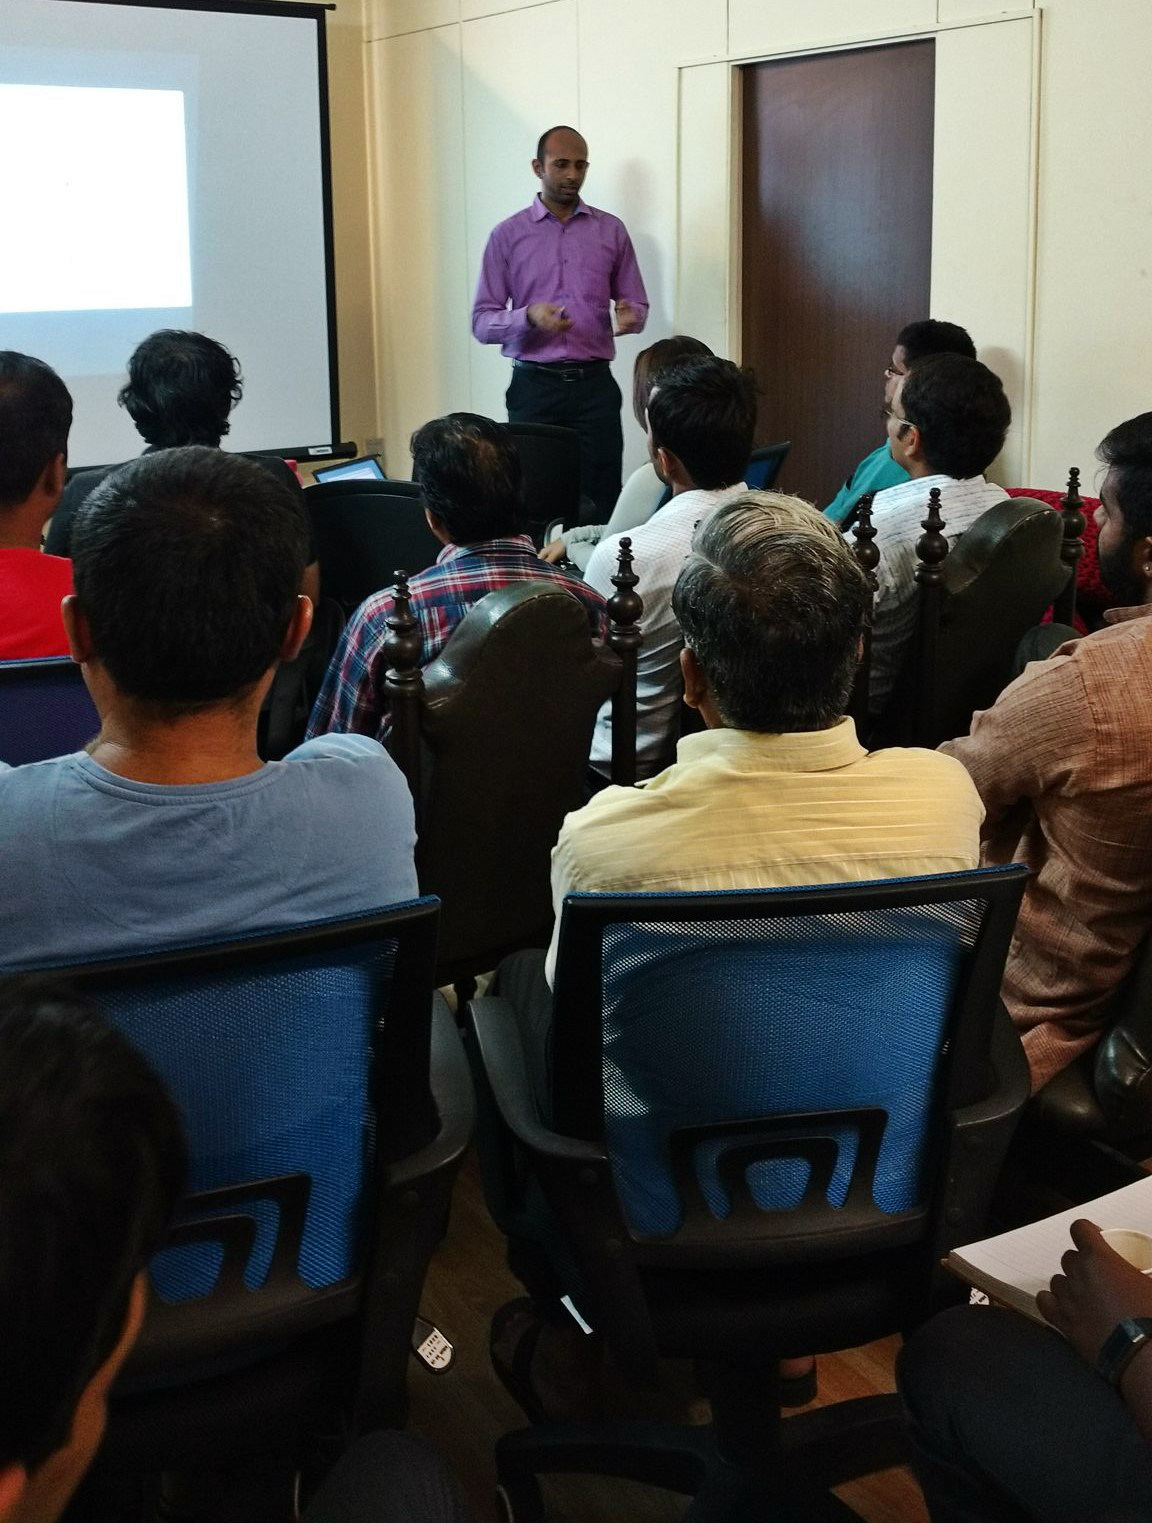
The fifth edition of the Digital Chai Pe Charcha was held at our office on 9th July 2016. It received a wonderful response with about 25 participants including entrepreneurs, professionals, digital marketers and social media influencers taking an active part. The topic of discussion was Measuring ROI from Digital Marketing.
Here’s a quick summary of the key takeaways from the session:
There are two types of returns from digital marketing:
1. Tangible Returns:
These are metrics that translate into immediate business results such as Leads, Sales, Registrations and Traffic
2. Intangible Returns :
These are metrics that do not measure immediate business results such as brand awareness, customer engagement, customer satisfaction and brand reputation.
Metrics you measure will depend on your business goals and objectives.
For example, if your objective is lead generation, then you would measure metrics such as Leads/Enquiries Generated, Revenue from Sales, App Installs and Website Traffic.
On the other hand, if your objective is brand awareness, then you would measure metrics like likes/fans/followers, reach, impressions, mentions, social engagement, likes/comments/shares and retweets/reposts.
There are a number of tools available to measure the metrics mentioned above. They could be categorised as web, mobile, and social media analytics tools.
Web Analytics tools:
There are a number of web analytics tools that you could use. You could use Google Analytics to understand details about the volume and quality of your website traffic. Tools like Kissmetrics, help determine advanced analytics on the behaviour of your users.
Mobile App Analytics Tool
For those of you have the mobile app for your business, tools like Mixpanel and Appsflyer help you learn how people use your app. It also helps draw insights from this data to optimize and improve your marketing for better ROI.
Social Media Analytics Tools:
These tools help you analyze the effectiveness of your social media marketing efforts by measuring metrics like likes/fans/followers, reach, impressions, mentions, engagement, likes/comments/shares and retweets/reposts. Social platforms like Facebook, Twitter, Pinterest, and LinkedIn have inbuilt analytics tools for marketers to analyze the effectiveness of their marketing efforts. Other advanced analytics tools for social media intelligence include Radian6 and Simply Measured.
Call Tracking:
With the growth in mobile use globally, the number of leads coming through phone calls is increasing rapidly as compared to leads through web forms. In this scenario, it is important to use tools like Knowlarity and Exotel to track call leads effectively and attribute them to the right source.
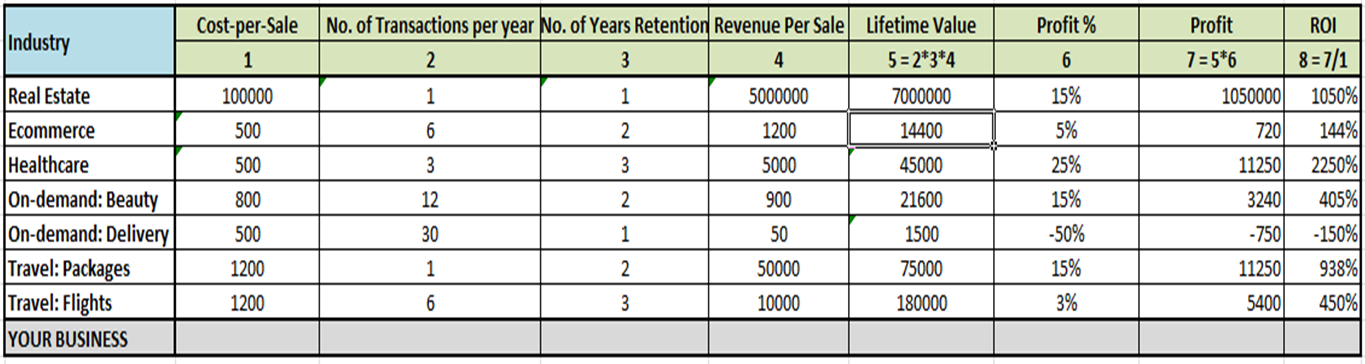
The simplest way to measure if ROI from a channel would be positive, is by checking if the Customer Lifetime Value (LTV) is greater than the cost of acquiring a customer through that channel.
The table below will help you with a simplified framework to calculate LTV. For more details on LTV calculation, you can read our article on Customer Lifecycle Value vs Cost of Acquisition in E-commerce.
Participants then did this analysis of LTV and cost of acquisition to calculate channel ROI for their businesses. They shared their learnings with the rest of the group. This was followed by an interactive discussion and Q&A session.
Those of you who missed the first four editions of the Digital Chai Pe Charcha can check them out below:
Edition 1 – Challenges Faced In Marketing A Startup
Edition 2 – Content Marketing Success In 2016
Edition 3 - 101 On Digital Advertising For Startups
Edition 4 - How To Use Instagram For Business
You can follow us on Facebook and Twitter! Check out the hashtag #DigitalCPC for more details on the next Digital Chai Pe Charcha meet.
What methodology do you use to calculate ROI from your digital marketing efforts? Do share your method, experience, and learnings in the comments below!
Micro Moments has become a buzzword in the digital marketing environment in recent times. Especially, after Google’s content marketing team, Think with Google, came up with this phrase, more and more digital marketers are trying to utilize the micro moments to benefit their brands.
To start with, more and more consumers are using smart phones for most of their browsing. According to two different Google consumer surveys, almost 68% of smart phone users say that they check their smart phone within 15 minutes of waking up every morning; also, 30% of these users admit that they actually get anxious, when they don’t have their smart phones with them. In most countries, searches happen more via mobiles than desktop computers. This means that digital marketers, who intend to make an impression with their clients, should adapt mobile first strategy religiously.
According to the often quoted KPCB Internet Trends Report, it is said that most people check their phones about 150 times a day and they spend 177 minutes on an average with their phones per day. This means that, on an average, a mobile session lasts for just 70 seconds. Apart from texting their partners, sharing their selfies or travel pictures, commenting on their friends’ photos, there is a specific point of time where people look at their smart phones to get influenced by brands. These small moments where the consumers look for information on their phones are the micro moments that every digital marketer should utilize.
According to Think with Google, these micro moments can be classified into four, namely:
These are the four micro moments that are crucial for any business. With consumers’ online attention span being very low, i.e. as low as few seconds, to leverage these micro moments of consumers, brands must adapt mobile first strategy.
To grasp your consumers’ micro moments, a brand must refine all its contents to be mobile responsive and follow these four approaches.
One of the interesting facts about most consumers is that they might not be rigid on what brand they want. If they are looking at their phone for information or merely browsing, they might be more interested to buy your products if the information you provide interest them. Especially, while looking for information, users pick the business that are there in their search results and that have the most attention-seeking content.
By being there always in their smart phone, via both paid and organic methods, you stand a more chance than your competitors to convert them into your customers. One may think that by merely being there in the social media, how can a brand make the smart phone users become its consumers. The true fact is that by being there when users need some information, your brand is helping customers in their decision journey.
Also, at this point, mobile first strategy plays a major role. Since most of the searches happen via mobile phones, your website, landing pages, ads, posts, and any content should be mobile responsive. Also, it must be interesting and crisp to be read within those micro moments.
While you can make an amazing first impression with the first approach, to make the users your clients/customers, you need to do something more; in fact, you must do something more powerful. Bounce rate of many sites and uninstalling of many apps are on a rise; the main reason for this is that most of these brands fail to be useful to their customers in the four micro moments explained above.
If your consumer is on a search engine searching to buy a product related to your brand, he or she is more likely to pick your brand over a hundred others when your content is useful than the others. We have a detailed strategy on how to create 10X better content than your competitors. With mobile first strategy, you are in a good spot because it allows you create and showcase more pertinent content in these micro moments. This is why in our view a blog is important for every business. Using information like their past search history, location, time of search, and keywords, one can efficiently decide what to showcase to which user.
For example, if you are a brand that has multiple products, based on the target group, their preferences, you can use retargeting to showcase products/creatives that are useful to them. Rest assured, you would have definitely leveraged their micro moment.
If your mobile site or app takes a long time to load, the users are more likely to leave your site/app for other that of other brands. All your efforts of providing useful content and being there goes waste, if the speed at which your information loads is slow. To optimize your mobile site and app speed to suit the speed of your customers, you must follow these steps:
Almost 40% of users wait not more than 3 seconds for a site to load before leaving the site, if you do not optimize your site better, all your other efforts becomes futile.
You have done your best by being there, being useful, and being quick. With mobile first approach, these efforts will definitely reap results. The results can either be customers or leads to prospective customers. However, on the longer run, measuring and reviewing your micro moments strategy is what helps you to refine and evolve with the evolving trends.
The fourth edition of the Digital Chai Pe Charcha was held at Karya Space on Saturday, May 28th 2016. The turnout for this event was fantastic with over 60 entrepreneurs, working professionals and social media influencers participating in the session. The topic for this session was all about Instagram and how it could be used to leverage business.
Instagram is a very powerful platform which when used correctly can help brands and business reach out to a niche and specific audience. The customers that brands acquire through Instagram can display strong loyalty towards the product or service.
Here’s the presentation that was discussed during the session
[embed]http://http://www.slideshare.net/socialbeat_ss/how-to-use-instagram-for-your-business[/embed]
It was a very interactive session with the participants sharing their personal experiences with Instagram and asking plenty of questions. Here are few tweets shared by participants about the event.
Here’s a quick recap for those who attended the session and for those who could not make it yet would like to leverage Instagram for their business
While these pointers can help you, like any other platform, Instagram is constantly changing and brands will have to adapt and implement these changes. In fact over the past couple of days, Instagram has rolled out a massive algorithm change due to which you will see posts based on your interests rather than chronological order. The reach due to hashtags will decrease and your followers will be more important than ever.
What has you experience with Instagram been so far? Do share your feedback in the comments!
ComScore recently published a report that highlights the advertising benchmarks for the year 2016. As a leading global cross-platform measurement company that accurately assesses audiences, brands, and consumers, comScore has analyzed and published a report on how ad blocking, invalid traffic, and viewability of ads are impacting delivery of advertisements across the globe. The report also lists what the concerned industries can do to tackle these challenges. The following is a brief summary on the key learning from the report.
The digital marketing industry, particularly the digital advertising industry, has experienced constant and powerful growth that has not show any signs of decline, so far. However, in order to continue its global rise, the industry needs to guarantee clean ad delivery, i.e. ads should be viewable to the consumers, and it should be free from fraud. Nevertheless, an ad that is not seen by consumers cannot have any impact.
Based on research and data mining, the comScore report enlightens us with some key learning across the following three extensive categories.
Young users aged 18-24 are more likely to block desktop ads than any other average user. In fact, young males are 100% more likely and young females are 42% more likely to block ads in comparison with other users from the US. Moreover, users from higher income segments block ads more than average users.
The sole way to resolve this issue is to refocus on user experience. These statistics are a wake-up call for all the digital advertisers to improve their ad quality in terms of content as well as user experience. Seeking less invasive options, with or without advertising, can also be a good alternative.
In December 2015, almost 80% of the global invalid traffic (IVT) was sophisticated. Additionally, ads that have less transparency like video ads on programmatic exchanges are almost 4.5 times more prone to IVT than its direct counterparts. In general, with wider CPMs, videos give a higher chance for IVT than display ads.
Sophisticated IVT requires advanced analytics to detect. Therefore, it is very crucial to protect websites and all ad campaigns using latest methods like comScore Triple Detection Technology, which goes beyond the standard filtration. This sophisticated IVT detection tool uses three key data assets, viz. ad tags, census page tags and a panel of humans. Detection methods like these not only measures invalid traffic, but also provides more protection. If sophisticated IVT detection methods are not in place, the whole advertising processes might go into waste.
According to this comScore global report, more than half of ads worldwide still don’t have the opportunity to be seen. The desktop display viewability ranges from 39%-50% across all markets. Video viewability is even lesser; this is due to IVT on programmatic video exchanges. According to research, direct buys see higher viewability than their programmatic counterparts.
For better viewability and impact, one needs to improve delivery. Invalid traffic together with low viewability can create mayhem in any campaign. Therefore, when the performance of a campaign is evaluated only by using ads that have an opportunity to make an impression, advertising can be made two times more efficient. This will help publishers prove the worth of their advertising and marketers measure the true return on investment (ROI).
To summarize, ad blocking, invalid traffic (IVT), and low viewability are the three key challenges in digital advertising. However, by taking the above mentioned steps, clean campaign impressions and potent results can be guaranteed.
The real estate industry in India and Bangalore in particular is growing rapidly with real estate companies establishing new developments in and around the city. Real estate developers are also using digital marketing to update their clients and potential clients on the new projects and any exciting news that they may have.
From opting for a responsive website to having engaging social media content across channels, real estate developers are including digital marketing as part of their marketing and sales strategy. Keeping this in mind, we have put together a detailed report on the digital marketing strategies of some of the top real estate developers in Bangalore.
With developments ranging from residential to retail, from commercial to hospitality sectors, Mantri Developers are one of the few real estate businesses that have provided high-quality properties that match the current trends and future needs.
Mantri Developers have a descriptive website that covers details of all their projects elaborately.
Key features:
Website Insights:
| Total visits | Avg time on site | Page views | Bounce rate |
| 46.2K | 0:02:57 | 3.8 | 49.58% |
span style="font-weight: 400;">UX Audit: From a user’s perspective, this website has a lot of useful information. However, a more organized and spacious layout would connect better with the users and improve their experience.
Moz Rank: They have a Moz Rank 40 for Domain Authority.
Website Speed:
Twitter: They have an active Twitter account with around 3k followers. They do 4 to 5 tweets per week and have many promoted tweets too. The tweets are good from the users’ perspective. However, the engagement is low.
Facebook: They also have an active page with only organic posts and around 20k followers. Although they have tried interactive posts like the one shown below, the engagement is quite low. However, they can try to boost their posts to make it reach masses.
LinkedIn: They have a LinkedIn business page with around 4k followers. No recent updates are there in the page, but the older posts have good engagement. They respond to the comments on posts, which gives really good impression to the audiences.
YouTube: They have an active YouTube account with 164 subscribers. They post one or two videos every month which has good engagement.
Their Google+ and Instagram Pages are not active.
They have a Wordpress blog, but the last post was in August 2013. Blogs can give them a lot of traffic, so they should start posting at least one blog per month.
Prestige Developers is a real estate company that has triumphantly built a lot of residential, commercial, retail, leisure & hospitality based properties.
Prestige Developers have a common website, which covers detail of all their projects across all the cities they are serving currently. Their website is mobile responsive.
Website Insights:
| Total visits | Avg time on site | Page views | Bounce rate |
| 147.7K | 0:02:56 | 2.89 | 54% |
UX Audit: The elite images rolling in the banner connects the user to the luxury of the brand. The main menu could have been more prominent, instead of being placed against the sliding banners, but that apart, the site has very nice organization of the project information - presented state-wise and sorted by price.
Moz Rank: They have a Moz Rank 42 for Domain Authority.
Website Speed:
Twitter: They have an active Twitter account with around 2.5k followers. They do 10 to 12 tweets per week and have no promoted tweets. The tweets are mostly about their projects or on reasons to buy property. And the engagement on tweets is decent.
Facebook: This is also an active page with around 4 lac followers. All posts are organic and the engagement is low. They have almost same posts on Facebook as the ones they have posted on Twitter.
LinkedIn: They have a LinkedIn business page with around 3.5k followers. The page is active and engagement is also decent but they are posting same content on all the channels. They should differentiate the content as the audiences are different in different channels of Social Media.
YouTube: They have a YouTube account with 867 subscribers but it is not active. The last post was posted a year ago.
Their Google+ is not an active account, and they don’t have Instagram Page.
They don’t have any blog linked to their website. Blogs are a very good source of traffic and link building, so they should start a blog and link it to their website.
Tata Housing is one of India's leading real estate developers. It is a closely held public limited company and is a subsidiary of TATA Sons.
They have a website that covers details of all their current projects. Website has many tools like EMI calculator, Property finder, etc. and has a payment option as well.
Key Features:
Website Insights:
| Total visits | Avg time on site | Page views | Bounce rate |
| 144K | 0:01:47 | 2.72 | 65.56% |
UX Audit: The website comes with a clean layout and a very neat color scheme. One of the hugely useful utility – Search, is well planned here. User experience could be enhanced by placing the search in the primary top portion of the layout – so that it is easily discoverable. Every internal page corresponding to a project, has a different color scheme suited to the image. Even though the common practice is to maintain color consistency across pages, from the UX perspective this is indeed appealing.
Moz Rank: They have a Moz Rank 39 for Domain Authority.
Website Speed:
Twitter: They have an active Twitter account with around 14.5k followers. They do 3 to 4 tweets per week and don’t have promoted tweets. They have a diverse set of tweets ranging from customer testimonials to the initiatives they have taken in general. The engagement on tweets is good.
Facebook: This is also an active page with around 2 lac followers. All posts are organic and the engagement is good. They have interesting posts like the one shown below:
LinkedIn: They have a LinkedIn business page with around 12.5k followers. The page is active, and the engagement is also good. Content is exactly same as what they have posted on Twitter.
YouTube: They have an active YouTube account with 1187 subscribers. They post 1 video every month mostly about their new projects.
Their Google+ is active with around 600 followers, and their Instagram account is not active.
They have a blog which is linked to their website. The blog is not active as last post was on 6th Jan 2016.
Founded in 1976, Sobha Group is one of the largest real estate organisations in India and the Middle East. Today, they have presence in 24 cities and 13 states across India and throughout the Middle East.
They have a website that covers detail of their current project in all the cities they are serving in India, and they have an option to go directly to Dubai site.
Key features:
Website Insights:
| Total visits | Avg time on site | Page views | Bounce rate |
| 226.8K | 0:03:10 | 3.3 | 59.85% |
UX Audit: The submenus on the main menu are very interesting, with an image and well placed submenu items. Even for mobile, the menu is optimized well. The banner is the most informing entity of their website. It covers all the deals, promotions, new launches, etc. Usually extensive sliding banners don’t work, from user perspective. However, since the information below the banner is very minimal, the user has a better opportunity to focus on the extensive banner.
Moz Rank: They have a Moz Rank 32 for Domain Authority.
Website Speed:
Twitter: They have an active Twitter account with around 2k followers. They do 5 to 6 tweets per day, which is a lot as compared to their competitors. They have a diverse set of tweets ranging from their new projects to the general industry based news. Despite these, engagement is low on tweets.
Facebook: They have an active page with around 5.5 lac followers. All posts are organic, and the engagement is good. They have interesting posts like customer testimonial which is shown below:
LinkedIn: They have a LinkedIn business page with around 15k followers. The page is active and engagement is also good. Content is almost same as what they have posted on Facebook.
YouTube: They have a YouTube account with 466 subscribers but it is not very active. The last post was 8 months back.
Their Google+ is active with around 515 followers, and their Instagram account is not active.
They have a blog which is not active. They do not have any mention to their blog on their website.
Century Real Estate prides itself on being an integrated, full-service landholdings development company that offers the best real estate & property developers in Bengaluru.
They have a descriptive website, which covers detail of their current project in all the cities they are serving in India.
Key features:
Website Insights:
| Total visits | Avg time on site | Page views | Bounce rate |
| 20.5K | 0:04:48 | 3 | 46.54% |
UX Audit: The elevation overview image used in the banner is very attractive. It gives a very detailed idea of the luxury and environment of the residential project. The location sorter-tab is a good utility to filter residential projects in specific areas. The slide-in enquiry form looks neat and works comfortably.
The section ‘Bangalore - the place to be’, is well aligned with the idea of living in a place overlooking green luxury – the strength of their residential project.
Moz Rank: They have a Moz Rank 27 for Domain Authority.
Website Speed:
Twitter: They have an active Twitter account, but the followers are very less; it is around 50 only. They do 5 to 6 tweets per week, but the engagement is very low. Some of the tweets are interesting which give emphasis on Call-To-Action as the one mentioned below:
Facebook: They have an active page with around 47k followers. Some posts are organic, and some are boosted, and the engagement is good overall. They have interactive posts like the one shown below:
LinkedIn: They have a LinkedIn business page with around 1.2k followers. They don’t have any post on their page till now.
YouTube: They have a YouTube account with only 13 subscribers and it is not very active. They post once in around 3 months.
Their Google+ is not active, and they don’t have Instagram account.
They have an active blog which is linked to their website. And they have newsletter sign-up option for their blog.
The Puravankara Group commenced operations in Mumbai and has established significant presence in the metropolitan cities of Bangalore, Kochi, Chennai, Coimbatore, Hyderabad, Mysore and overseas in Dubai, Colombo and Saudi-Arabia.
They have a website with categories for cities they are serving in India and then cities have description of their current projects.
Key Features:
Website Insights:
| Total visits | Avg time on site | Page views | Bounce rate |
| 91.4K | 0:01:44 | 2.2 | 67.51% |
UX Audit: They have a very interesting drop down menu with all their residential projects listed. The supporting icons plus location information makes way of navigating to residential options more convenient.
Website Speed:
Twitter: They have an active Twitter account but the followers are very less, it is around 360. They do 5 to 6 tweets per week but engagement is low. Most of the tweets are themed around investment like the one shown below:
Facebook: They have an active page with around 37k followers. The posts are organic and have decent engagement.
LinkedIn: They have a LinkedIn business page with around 4k followers. They don’t have any post on their page till now.
YouTube: They have an active YouTube account with around 400 subscribers.
Their Google+ is not active, and they don’t have Instagram account.
They have a blog, but it is not active. It is also not linked to their website. The last post was in 2014.
Ozone Group one of the top builders in Bangalore & Chennai among the real estate construction companies.
They have a website with description of their projects on the banner images, which is very visual and catches the attention.
Key Features:
Website Insights:
| Total visits | Avg time on site | Page views | Bounce rate |
| 72.2K | 0:01:23 | 1.76 | 72.22% |
UX Audit: The information architecture of this page is very well-planned. Banner information with different projects and their status, makes it a valuable source of information. The website has a very well-built footer with latest news, enquiry form, and contact us.
Moz Rank: They have a Moz Rank 35 for Domain Authority.
Website Speed:
Twitter: They have an active Twitter account with around 1.5k followers. They do 2 to 3 tweets per week, but engagement is low. Most of the tweets are informative, like the one shown below:
Facebook: They have an active page with around 1 Lac followers. The posts are organic and have decent engagement. They have many images posted for different occasions.
LinkedIn: They have an active LinkedIn business page with around 800 followers. They have posts related to their achievements and activities on their page.
YouTube: They have an active YouTube account, but the subscribers are less. They have almost one video upload every week.
Their Google+ is not active, but the Instagram account is active with similar posts as Facebook.
They have a blog which is active, and it is linked to their website. Content is mostly about their projects.
Architect led design company in real estate development, Total Environment creates luxury apartments and villas for sale in India.
They have a website with very less content. They have put images of all their projects and every image has a small description of the project.
Key Features:
Website Insights:
| Total visits | Avg time on site | Page views | Bounce rate |
| 10.7 K | 0:04:42 | 11.86 | 22.30% |
UX Audit: The image slider is very different from the usual websites. It focused on every facility that the residence provides, thereby giving the user an entire perspective of what they’re signing up for.
On the con-side, there is no evident attractive information about their residential projects; the user might lose out on the purpose of the page
Moz Rank: They have a Moz Rank 21 for Domain Authority.
Website Speed:
Twitter: They have a Twitter account with only 100 followers. The account is not active, last tweet was in April.
Facebook: They have an active page with around 15k followers. The posts are organic and have good engagement. They have interesting posts like the one shown below:
LinkedIn: They have a LinkedIn business page with around 2k followers. They have very few posts that are about job openings only.
YouTube: They don’t have an YouTube account.
Both their Google+ and Instagram are not active.
They do not have a blog.
Nitesh Estates is the luxury real estate brand, which has developed state-of-the-art homes, hotels, office buildings and shopping malls in India.
They have descriptive and visually appealing website, which tells about their projects and promotional activities in detail.
Key Features:
Website Insights:
| Total visits | Avg time on site | Page views | Bounce rate |
| 17K | 0:04:30 | 3.9 | 29.11% |
UX Audit:
Moz Rank: They have a Moz Rank 31 for Domain Authority.
Website Speed:
Twitter: They have an active Twitter account with around 9k followers. They do 5 to 6 tweets per week, but engagement is low. They have tried engaging in campaigns like the one shown below:
Facebook: They have an active page with around 42k followers. The posts are organic and have decent engagement. They have many posts that talk about the facilities they have in their projects like the one shown below:
LinkedIn: They have an active LinkedIn business page with around 3k followers. They have posts related to their projects and the engagement is good on their page.
YouTube: They have an active YouTube account with around 1.2k subscribers. They have almost 2 to 3 video uploads every 2-3 months.
Their Google+ is not active but the Instagram account is active with similar posts as Facebook.
They have a blog which is active and it is on their website. Content is very diverse ranging from general topics of real estate to specific topics like tour of their property.
Brigade Group is a real estate and property developer in Bangalore & the rest of South India since 1986.
They have very colorful website, which tells about their projects across various cities. Their website is Mobile responsive.
Website Insights:
| Total visits | Avg time on site | Page views | Bounce rate |
| 99.7K | 0:01:55 | 2.22 | 58.56% |
UX Audit: Quick Finder turns out to be an excellent feature and well-placed to a user’s visibility. Categorizing their properties based on Commercial, Retail and Hospitality is very thoughtful. However the second half of the website could have maintained a more prominent and vibrant color theme like the first half of the site.
Moz Rank: They have a Moz Rank 40 for Domain Authority.
Website Speed:
Twitter: They have an Twitter account with around 150 followers. The account is not active, and the last tweet was in 2015.
Facebook: They have an active page with around 13k followers. The posts are organic and engagement is low. They have tried interactive posts but still the engagement is low as the one shown below:
LinkedIn: They have an active LinkedIn business page with around 9k followers. They have posts related to their projects and the engagement is decent on their page.
YouTube: They don’t have YouTube account.
Their Google+ is not active, and they don’t have an Instagram account.
They have a blog, which is on their website. It is not active; last post was in December 2015.
3 decades of delivering Quality Homes has made DRA a name synonymous with quality apartment constructions in Bangalore.
They have a website with good description of their ongoing as well as upcoming projects.
Key Features:
UX Audit: Each of the individual projects has a set of features that can viewed by a simple click, and all changes being reflected in a single space. This is a very simple navigation.
Moz Rank: They have a Moz Rank 19 for Domain Authority.
Website Speed:
Twitter: They have an active Twitter account with around 300 followers. They do 4 to 5 tweets per week but engagement is low. Most of the recent tweets are about their new project.
Facebook: They have an active page with around 25k followers. The posts are organic and have decent engagement. They have most recent posts only about their new project.
LinkedIn: They have an LinkedIn business page with around 80 followers. They have no posts till now.
YouTube: They don’t have a YouTube account.
Their Google+ is not active and they don’t have Instagram account.
They don’t have a blog.
Casa Grande defines designs and develops quality livings spaces and operates in niche residential segments like luxury villas and apartments in Chennai, Bangalore, Coimbatore and Cochin. The company also sells plotted development spaces. Projects in the pipeline are to the tune of around 2500 crores in the luxury apartments and villas category across these 4 geographies.
They have a website which is visually appealing with big banner images, info-graphics and video testimonials from clients.
Key Features:
Website Insights:
| Total visits | Avg time on site | Page views | Bounce rate |
| 76K | 0:05:29 | 3.21 | 43.02% |
UX Audit: The semi-parallax look adds a luxurious feel to the general theme of Casa Grande. The well laid-out contact information at the top of the page facilitates easy contact. The feature that shows the number of completed, ongoing, and upcoming projects. Clean color theme of the website and well organized layout is a great advantage.
Moz Rank: They have a Moz Rank 22 for Domain Authority.
Website Speed:
Twitter: They have an active Twitter account with around 2k followers. They do 4 to 5 tweets per week, but engagement is low. Most of the tweets are same as the ones posted on Facebook.
Facebook: They have an active page with around 1.2 Lac followers. The posts both organic as well as sponsored posts have decent engagement. They have some engaging posts like the one shown below:
LinkedIn: They have an active LinkedIn business page with around 490 followers. They have posts related to their offers but the engagement is very low on their page.
YouTube: They have an active YouTube account but the subscribers are around 200 only. They have almost two video uploads every month.
Their Google+ is active but engagement is low, and they don’t have a Instagram account.
They have a blog which is active and it is linked to their website. They post almost twice per month which is good as compared to their competitors.
They have a website with description of their projects and lot of content related to their mission/ vision. They have videos of testimonials by their clients.
Key Features:
UX Audit:
Moz Rank: They have a Moz Rank 24 for Domain Authority.
Website Speed:
Twitter: They have an active Twitter account with around 150 followers. They do 4 to 5 tweets per month which is low as compared to competitors. The engagement is low on their posts.
Facebook: They have an active page with around 8k followers. The posts are organic and have decent engagement. They post once a week mostly.
LinkedIn: They have an active LinkedIn business page with around 100 followers. They have posts related to their achievements and activities on their page but the engagement is low.
YouTube: They have an active YouTube account but the subscribers are less. The last video they uploaded was 9 months back.
Their Google+ is active, but they don’t have Instagram account.
They have a blog tab on their website but after clicking it is re-directed to their home page only.
Mahindra Lifespaces is one of the most reputed real estate property developers and they provide a one stop solution for NRI investment in India.
They have a website which is very colorful and interactive.
Key Features:
Website Insights:
| Total visits | Avg time on site | Page views | Bounce rate |
| 56.6K | 0:02:19 | 1.76 | 65.56% |
UX Audit: Using green as a theme is very impressive to an audience in real-estate. The simple and clean design appeals to the user’s experience. Sticky enquire and book now buttons, really serve the purpose of contacting, comfortably.
Moz Rank: They have a Moz Rank 41 for Domain Authority.
Website Speed:
Twitter: They have an active Twitter account with around 1k followers. They do 2 to 3 tweets per week but engagement is low.
Facebook: They have an active page with around 1 Lac followers. They have both organic as well as sponsored post and have decent engagement. They have some video posts that are quite interactive.
LinkedIn: They have an active LinkedIn business page with around 22k followers. They have posts related to their projects mostly and the engagement is decent.
YouTube: They have an active YouTube account but the subscribers are less. They have almost 2 to 3 video uploads every month.
Their Google+ is not active and the Instagram account is active but engagement is low.
They have a blog which is active and it is on their website. Content is diverse which ranges from general real estate topics to specific topics like their projects.
Godrej Properties has been instrumental in the construction of Residential, commercial and township projects across 12 major cities in India & continues to be.
They have a website with all the information needed but it is very simple in terms of design. They have all the information on the banner images which is very visual.
Key Features:
Website Insights:
| Total visits | Avg time on site | Page views | Bounce rate |
| 209.2K | 0:01:20 | 2.05 | 72.01% |
UX Audit:
Moz Rank: They have a Moz Rank 46 for Domain Authority.
Website Speed:
Twitter: They have multiple Twitter accounts according to projects.
Facebook: They have multiple Facebook accounts according to projects.
LinkedIn: They have an active LinkedIn business page with around 33k followers. They have posts related to their activities and the engagement is good.
YouTube: They have an active YouTube account with around 550 subscribers. They have almost one video upload every week.
Their Google+ is active and in Instagram account they don’t have any posts.
They have a multiple blogs for various summits and projects.
~Other contributors to this blog post are Allan William, Pournima Balasubramanian, Nandita Raman, Rohit Uttamchandani, Srilakshmi Indrasenan, and Akila Priyadarshini.
On 29th April, a Friday, instead of our usual chit-chat sessions (conducted every Friday to share knowledge & learning from varied spheres of life), we did something different! The entire team received a new plan wherein we were all assigned a unique task!
Being in the digital marketing industry, we are usually immersed in technology. We rarely go out and meet the real consumers whom we target on digital platforms – the consumers to whom we build awareness and drive sales for our clients. It was the time that we went & understood these consumers better. So we headed to one of the largest malls in Chennai, Express Avenue in the hope of meeting such consumers.
The whole idea behind the session was to interact with people and find out the awareness of whether they are aware of the digital platforms and that they are being targeted with advertisements day in & out. The entire team of Social Beat was split into teams of two each. Half of the teams were targeting people to find out about their knowledge in the area of digital advertising. The other half had a client for each team and decided to find out the consumer awareness of the brand. The main objective was to conduct a survey amongst the audience we target through online mediums on a daily basis and this was a first time for us! The exercise lasted for about two hours. The teams garnered a lot of knowledgeable outcomes by the end of the day. “A face to face survey helped us analyze and gauge the reactions of people when they were answering the questions asked”, said Kruthika, our social-media specialist which tells how different was it from a usual online feedback and survey we take.
Our survey on Digital marketing involved asking the following questions to people:
• Do you click on ads on Facebook?
• Do you know what Google ads are and if yes, have you clicked on one?
• Do you pay attention to banner ads?
• Do you use an Adblocker?
• What was the last thing you bought online?
• Do you prefer shopping from websites or mobile apps?
The insights were pretty surprising as most of the people did not even know what Facebook and Google advertisements were or how they looked like. “We had a mixed experience meeting people. On one hand, it was great to talk to them and get insights. But on the other hand, most of them did not know anything about being targeted online via advertisements”, said Bindhya and Natasha. While that was the case with people not aware of ads online, they do pay attention to banner ads but only for informational purpose and the consumers claim not to click on display ads, but that's contrary to our experience where we receive meaningful leads and sales from Display advertising.
Coming to social media & Facebook ads, people are not aware of it because they do not know the difference between an organic post and an ad on their news feed. Fewer people who were aware of Facebook ads admit clicking on them only if it is attractive enough. Most of the people we met do not use an Adblocker on their browsers.
We also did a dipstick survey on whether the consumers are aware of our clients’ brands. Throughout the survey, the digital marketing experts at Social Beat were able to meet consumers, understand the reach of the brands (that we handle) and understand the competition in different industries. Many shoppers also highlighted that some of them still do not trust online brands (possibly biased by the fact that we were surveying these individuals in a mall). Word of mouth still plays a bigger role in influencing people so there is a lot of scope for Influencer marketing.
At the end of two hours, the activity was insightful and left us with an understanding that digital marketing has a long way to go!